This is good stuff:
Was the 1990s Home Run Production Out of Line?
By David Vincent
In the last five years, baseball fans have read and heard a lot of commentary from politicians and the media about what a travesty the home run totals have been since the mid-1990s. The average fan, having heard this mantra so much, has come to believe it is true. But is it?
In order to examine this question, we need a way to compare eras. Raw counting totals will not suffice. The method employed here is a "home run production rate." It is calculated not by dividing homers by at bats, similar to batting average, but by calculating how many circuit drives were hit per 500 plate appearances. The 500 plate appearance standard was chosen because the official minimum performance standard for individual batting championships as listed in rule 10.22(a) [in the 2007 edition of the rules] is 3.1 plate appearances times the number of games scheduled for each team. Thus, in the 162-game schedule, 502 plate appearances is the minimum, but that was rounded here to 500 for simplicity. The home run production rate will generate numbers that can be compared to other numbers that have some context for the reader, such as a 30-homer season by a batter.
Figure 1 shows a graph of the home run production rate for all major league players each year since 1919. One can easily see a gradual increase from 1919 to the present. The numbers in the charts do not represent the total homers hit in the major leagues for any one season but rather the home run production rate (homers per 500 plate appearances).
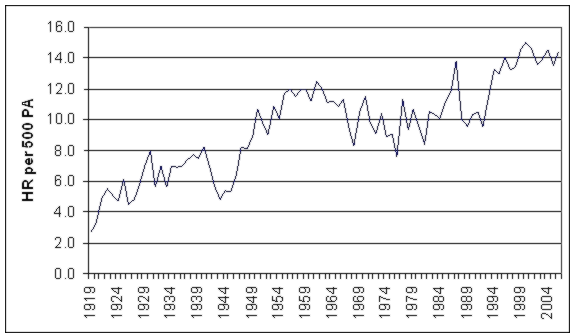
Figure 1 - Home Run Production Rate (1919-2006)
The fact that the home run production rate in the major leagues has increased steadily from 1919 to the present should not come as a surprise to many people. Many factors have affected the production rate, including rules changes, equipment changes and even some events outside of baseball. For a complete discussion of Figure 1, please read
Home Run: The Definitive History of Baseball's Ultimate Weapon, from which the figure is taken.
Figure 2 adds a trend line to Figure 1 and this trend line shows the steady increase in home run production from 1919 through 2006. The movement of the rate line around the trend line documents the pendulum effect of the production through the years. The home run rate topped 10 for the first time in 1950 when it reached 10.7 homers per 500 plate appearances. It dipped below 10 in the next two seasons, but from 1953 through 1966 the production rate was above 10 each season. This time period is the bubble above the trend line about half way through the chart from left to right.
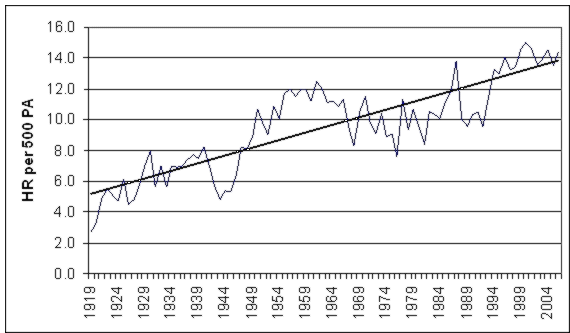
Figure 2 - Home Run Production Rate with Trend Line (1919-2006)
In 1994, the production rate reached 13.8 homers per 500 plate appearances, only the second time in history that the rate climbed above 13.0. From 1994 through the present, the production rate has been above the trend line with the exception of 2005. The highest point in the chart is 2000 when the production rate reached 15.0. However, it is evident from looking at Figure 2 that the period from 1950 through 1966 is further above the trend than is the period starting in 1994. Both periods follow time frames when the home run production rate was well below the trend line, further accentuating the explosion of homers in the following era.
As a side note about the last 13 years, Figure 3 shows the home run production rate from 1994 through 2006. The rate has held fairly steady through the period and, contrary to pronouncements by the commissioner, the production rate has not dropped in the years since Major League Baseball instituted its drug testing policy.
This is clearly shown by Figure 3 as the rate has held steady since 2001, slowly undulating around the 14.0 per 500 plate appearance line.
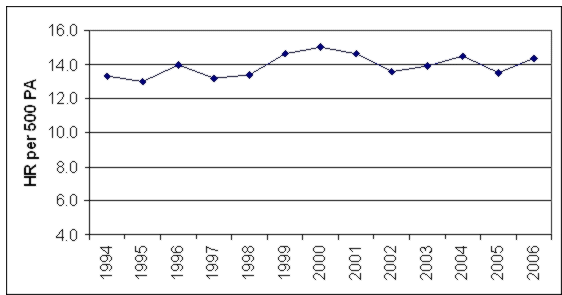
Figure 3 - Home Run Production Rate (1994-2006)
Another series of negative comments made in the last few years concerns the number of players joining the 500 Home Run Club. From August 5, 1999 through June 20, 2004, five players joined the club:
Mark McGwire (1999),
Barry Bonds (2001),
Sammy Sosa (2003),
Rafael Palmeiro (2003) and
Ken Griffey, Jr. (2004). That is five sluggers in about five years. Let's compare the period from September 13, 1965 through September 13, 1971. In those six years, seven players joined the 500 Home Run Club:
Willie Mays (1965),
Mickey Mantle (1967),
Eddie Mathews (1967),
Hank Aaron (1968),
Ernie Banks (1970),
Harmon Killebrew (1971) and
Frank Robinson (1971). Thus, more players (seven) joined the club in six years during the late 1960s than the five who joined in the first part of the 21st century. These 12 sluggers are the players primarily responsible for the surge in the home run rate in the 1950s and the 1990s. Four hitters are poised to join the club in 2007:
Frank Thomas,
Alex Rodriguez,
Jim Thome and
Manny Ramirez.
It is clear that the production rate of the late 1990s is closer to the trend line than was the rate during the 1950s. Perhaps the emotional statements at the beginning of the twenty-first century are overblown and misleading, since they are not based on factual evidence but rather on conjecture, and are more inflammatory than informative.
SABR member David Vincent, the "Sultan of Swat Stats," is the recognized authority on the history of the home run. He is the author of Home Run: The Definitive History of Baseball's Ultimate Weapon, published by Potomac Books, Inc.